Hi,
we have a problem that connections are leaked and closed.
We have created a simple project with one service and when i call this it seems to open new connections and don’t close them.
It worked fine in older version of Servicestack and .net framework 4.8 but once we upgraded to .net 7 and servicestack 6.0.10 we have this leakage.
The connection pool just grows and grows until it hits it limit.
I have checked everywhere where we do database calls that we have using statement around the Db
using (var Db = _dbFactory.Open())
Also the dbFactory is loaded from DI
container.AddSingleton<IDbConnectionFactory>(c =>
            new LoggingDbConnectionFactory(Configuration.GetConnectionString("db"), SqlServerDialect.Provider));
Can´t see that i’m doing something wrong and also it worked fine in older version.
I’ve put together a small running project with a simple service and also a ReadMe so you can see it.
public object Any(FindMovies query)
{
    using var db = AutoQuery.GetDb(query, base.Request);
    var q = AutoQuery.CreateQuery(query, base.Request, db);
    return AutoQuery.Execute(query, q, base.Request, db);
}
I’m not seeing any issue, everytime I see a connection open it’s closed again.
Connections are held open by default since they use a connection pool, if you disable connection pooling by adding ;Pooling=False to your connection string you should see them immediately closed after usage. You can also use ;Max Pool Size=... to specify the maximum pool size to use.
Where does your tracking say that a connection that was opened that didn’t have a matching OnDispose callback where it’s closed again?
The Db property will be disposed when the Service has finished being used, and disposed of itself. Your example also looks fine in the using statement.
Are you reusing your services else where via ResolveService or other ways? Something I have hit it the past is reuse of services from within a Razor rendering context that does require explicit .Dispose() calls due to how I think Razor rendering related objects are handled.
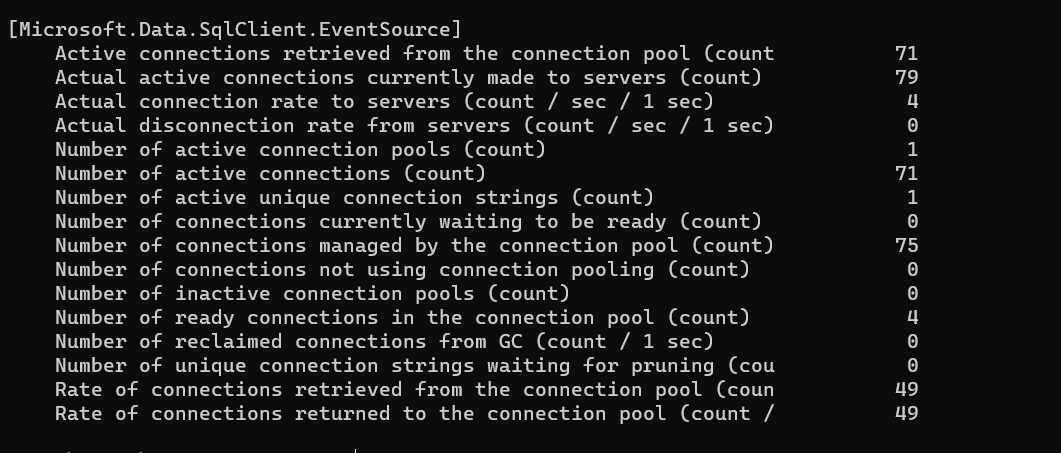
We’re consisently seeing a number of connections not being returned after running with applying load with JMeter for a minute or a couple of minutes. If monitoring event counters, it’s clearly visible the number Active Connections are slowly climbing (while 100x more are being held and returned meanwhile). We’ve tried analyzing memory dumps but we cannot determine why certain connections are being held.
On the SQL server side, all of these connections are completed and status is ‘sleeping’/AWAITING_COMMAND.
We’ve updated the github repo previously shared with more information about how to reproduce as well as included a memory dump, I hope this helps with reproducing the issue.
@bokamera Are you able to upload your sample/reproduction to a public GitHub repository? That may multiple people and others in the community can have a look, to help or learn about the issue you are seeing. Eg, currently I can’t access your example, but would like to have a look to see if I can help.
@layoric@mythz did you had any chance to look into this? I’ve had multiple developers on our side and they can’t see any issue from my example project that should generate this connection issue.
Also the service that im testing against is only reading from one simple db table using autoquery.
Running with the JMeter you can easily see the connections are not released back and it within a few minutes you will have connection pool error
There is a lot going on in that project that would require significant time to go through to understand and test for you. A minimal reproduction would generally only contain the parts related to the issue you are seeing. This approach of building a stand alone minimal reproduction has two fold benefits, it helps is diagnosing the issue you are seeing and it increases the chance others will be able to help since it is minimal in regards to size, dependencies, moving parts etc.
I’d suggest starting a new project from one our templates, adding in just database related code, testing along the way until you see the same issues you are seeing in production to try to nail down exactly what is holding onto your connections.
Even your load test is currently performing 13 different calls. If you don’t want to use the ‘additive’ approach, I’d suggest first trying to isolate that down to one endpoint causing the problem, and work backwards from there. Once you have found the offending endpoint, strip away unused code, rerun tests as you go.
I can see a few different areas using DB connections you might want to look at:
MembershipProviderWrapper - For some reason you have a local property of IDbConnectionFactory and yet use HostContext.AppHost.Resolve within a method. Stick to one approach, at least within a single class
Remove LoggingDbConnectionFactory, reduce number of touch points for DB connections
Again, there is a lot going on here, you will need to strip back what you can, and use external tools during load tests to see what SQL commands are being run on the connections that get ‘stuck’. I have more experience with Postgres, so I would be using things like PgHero to monitor those kinds of details for example.
Hi,
I have removed a lot of code (ie MembershipProviderWrapper ) and the LoggingDbConnectionFactory.
So it’s a really simple project now and only one service we call in the JMeter but still we get this connection pool issue. You can test it in the same project
We have run a lot of sql monitoring and as it’s only one table it selects from i cant see any issue. And it works fine until we get more traffic (running with example 200 threads in Jmeter).
So it must be something with the AutoQuery that gives us the Connection pool issue.
While you might have modelled in your head how everything works about this project, wading through 11k lines of just C# to figure out what is interacting together is time consuming.
Let’s look at the error itself (emphasis is mine)
System.InvalidOperationException: Timeout expired. The timeout period elapsed prior to obtaining a connection from the pool. This may have occurred because all pooled connections were in use and max pool size was reached.
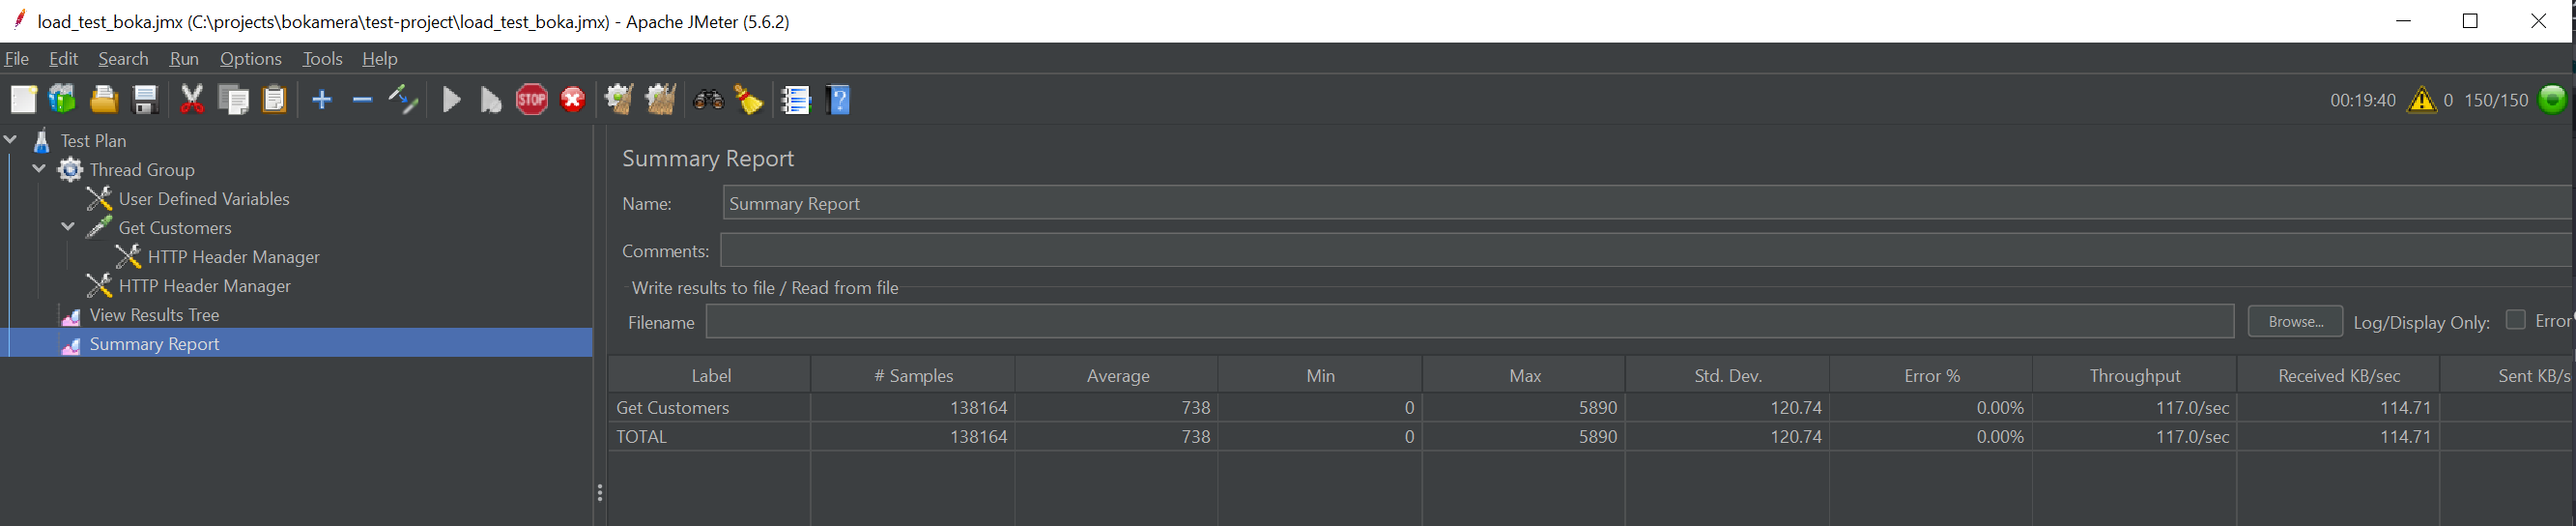
In the end, this is a timeout error, the application was waiting for the DB to respond in a set amount of time and it didn’t. When I run your test which kicks off load from 0 to 200 users over a duration of 1 second, yes, we get this error. I tried again with 150, sure enough, it failed again with the same issue. If I then increase that duration out, but leaving the load test at 150 (so eventually 150 concurrent users are still load testing), I get no issues. JMeter is showing:
I have over 150k samples, so at least that many DB connections have been made (and counting). The issue is you are either overwhelming your app server or database to cause a timeout. There is no db connection leak, you are simply trying to open too many concurrent connections for either your application or db to handle over a short period of time. If there was a DB connection leak, a slower ramp load test would still fall over. It doesn’t.
In future, issues need to be provided with a minimal reproduction proving that an issue exists, otherwise you will need to purchase premium support incidents.
First of all thx for your support looking into this and second thing I didnt know it was possible to buy Premium support, i will definitely use this next time it’s something urgent as we used Servicestack for +12years.
About the progress we found and isolated the problem to the ApiRequestFilter which does a single Db call. When using Dependency Injection to load the DbFactory and then run the query it leaks the connections.
When changing to use SqlConnection instead of the DbFactory we dont have the leaking problem and it returns the connections back.
I’ve updated the project and removed ALL other unnecessary code and just kept.
CategoryService
ApiRequestFilter (which causing the problem). I’ve create 2 methods here, one thats working with SqlConnection and one with leaking connections using DbConnectionFactory.
To summarize it.
In AppHost we register our RequestFilter and DbConnectionFactory
container.AddTransient<IDbConnectionFactory>(c =>
            new OrmLiteConnectionFactory(Configuration.GetConnectionString("db"), SqlServer2012Dialect.Provider));

    var apiKeyFilter = new ApiKeyRequestFilter(container.Resolve<IDbConnectionFactory>());
        container.Register(apiKeyFilter);
        GlobalRequestFilters.Add(apiKeyFilter.Verify);
The failing example
In the ApiRequestFilter we use the DbConnectionFactory as this
Will just leak until i stop the project and Active connections retrieved from the connection pool will reach 100 and pool will get full. Even if it set higher pool size it will reach that
When I did my original testing at the time, I couldn’t reproduce the error. Also when I tested it, IDbConnectionFactory was registered as a Singleton, which it should be. Any reason why you are trying to use it as a transient dependency?
A quick clean up of the IsValid code base, I would use:
private async Task<bool> IsValid(string remoteIP, string apiKeyRequest)
{
    if (apiKeyRequest == null)
        return false;

    using var dbCon = await _dbFactory.OpenDbConnectionAsync();
    var apiKeyParse = Guid.Parse(apiKeyRequest);

    var allKeys = await dbCon.SelectAsync<APIKeys>(q => q.Active == true && q.ApiKey == apiKeyParse);
    //var allKeys2 = await dbCon.SelectAsync<APIKeys>().ConfigureAwait(false);

    var res = allKeys
        .Where(k => k.ApiKey == apiKeyParse)
        .Any(k => k.ApiAllowedIPAdresses == null || k.ApiAllowedIPAdresses.Contains(remoteIP));


    return res;
}
Without a clean minimal reproduction, there isn’t a lot I can point to as to why you are seeing leaks. Best if you use a docker-compose environment as well so it is easy to stand up related infra like databases rather than connecting to a cloud hosted solution.