Hello,
I’m seeing a performance issue which I can’t figure out.
I have an API endpoint which returns data from a OrmLite query.
When I request the page without any “Accept” header the page performs extremely well.
M:\>curl -w "@curl-format.txt" "http://localhost:18088/api/broadcast/stations" -H "Cookie: ss-id=PZgbO14exQKkQF72Fs3l; ss-pid=HAyYGBgA1pK6E7eMMGSH; ss-opt=temp; X-UAId=1" -o NUL
  % Total    % Received % Xferd  Average Speed   Time    Time     Time  Current
                                 Dload  Upload   Total   Spent    Left  Speed
100  288k    0  288k    0     0  4659k      0 --:--:-- --:--:-- --:--:-- 4659k
    time_namelookup:  0.000000
       time_connect:  0.000000
    time_appconnect:  0.000000
   time_pretransfer:  0.015000
      time_redirect:  0.000000
 time_starttransfer:  0.062000
                    ----------
         time_total:  0.062000
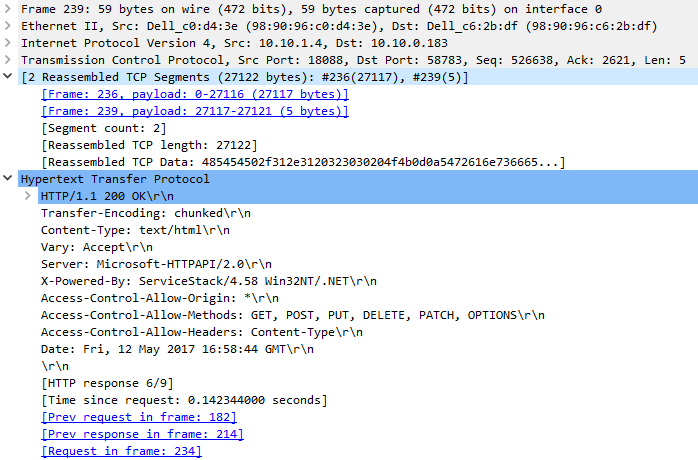
Here you can see that we downloaded 288KB from localhost in 62ms. There are no razor templates at play here, so the resulting HTML is the default ServiceStack data renderer which appears itself to be based on the JSON data.
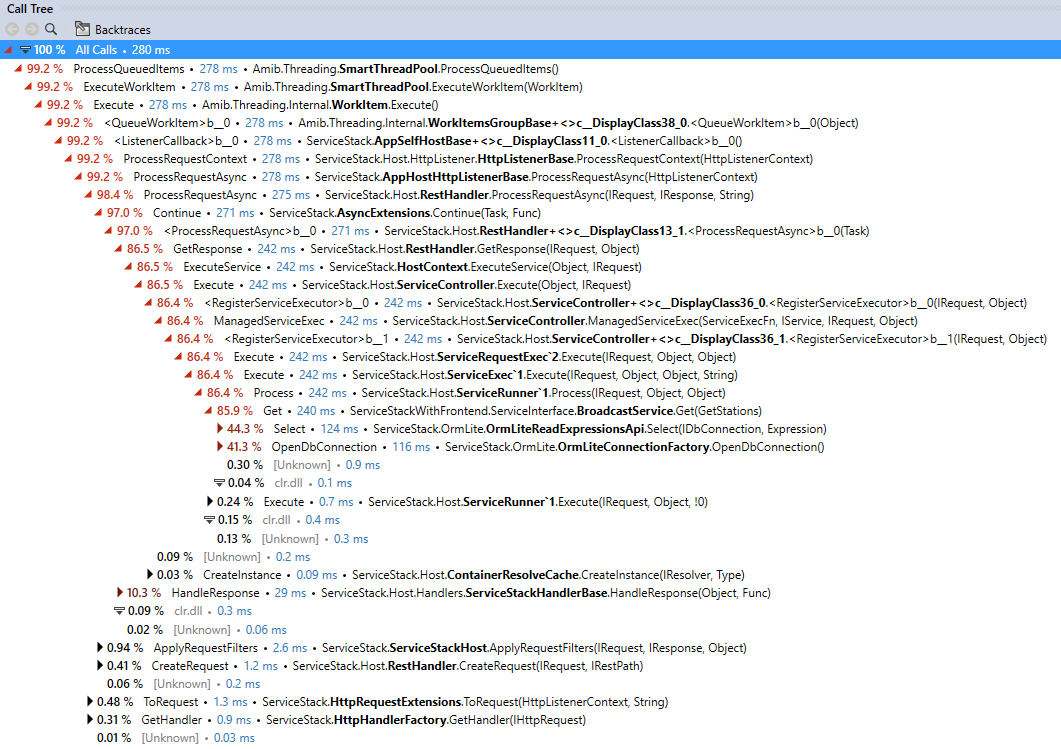
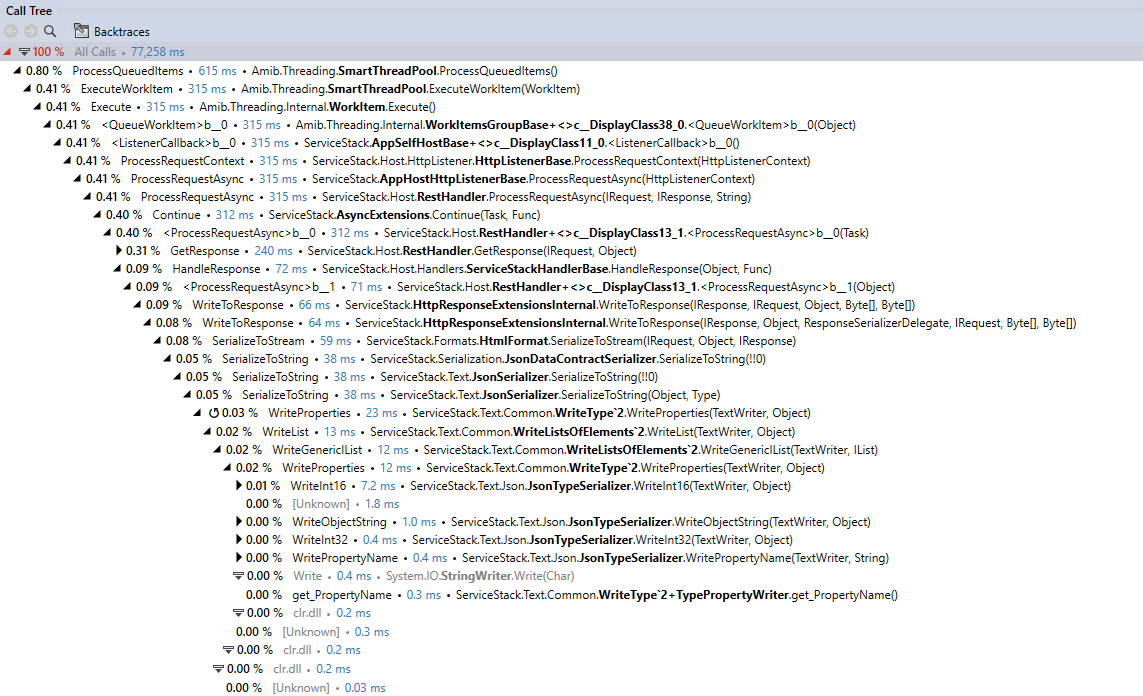
When I go to test the performance of endpoint using Accept: application/json performance is significantly degraded:
M:\>curl -w "@curl-format.txt" "http://localhost:18088/api/broadcast/stations" -H "Cookie: ss-id=PZgbO14exQKkQF72Fs3l; ss-pid=HAyYGBgA1pK6E7eMMGSH; ss-opt=temp; X-UAId=1" -H "Accept: application/json" -o out.txt
  % Total    % Received % Xferd  Average Speed   Time    Time     Time  Current
                                 Dload  Upload   Total   Spent    Left  Speed
100  279k    0  279k    0     0   119k      0 --:--:--  0:00:02 --:--:--  119k
    time_namelookup:  0.000000
       time_connect:  0.000000
    time_appconnect:  0.000000
   time_pretransfer:  0.000000
      time_redirect:  0.000000
 time_starttransfer:  0.047000
                    ----------
         time_total:  2.344000
Here you can see that despite returning slightly less data (because no HTML is included) the query took more than 2000ms.
I don’t think this is related to any kind of caching because the discrepancy is consistent even right after startup.
This feels to me like it may be a routing problem or something, but I’m not at all sure where to look.
The Service Model looks like this:
namespace ServiceStackWithFrontend.ServiceModel
{
    [Route("/api/broadcast/stations")]
    public class GetStations : IReturn<StationListResponse>
    {
    }
    public class StationListResponse
    {
        public List<Station> Stations { get; set; }
    }
}
And the service itself looks like this:
public class BroadcastService : Service
{
    private readonly IDbConnectionFactory dbFactory;

    public  BroadcastService(IDbConnectionFactory factory)
    {
        this.dbFactory = factory;
    }
    [Authenticate]
    public Object Get(GetStations request)
    {
        StationListResponse response = new StationListResponse();
        using (var db = dbFactory.OpenDbConnection())
        {
            response.Stations = db.Select<Station>(s => s.Active == 1);
        }
        return response;
    }
}
It’s being manually registered in the App using this:
container.Register(new BroadcastService(new OrmLiteConnectionFactory(container.Resolve<IAppSettings>().GetString("OrmLiteMMSConnectionString"), SqlServerDialect.Provider)));
Any idea why there would be such a significant performance discrepancy?