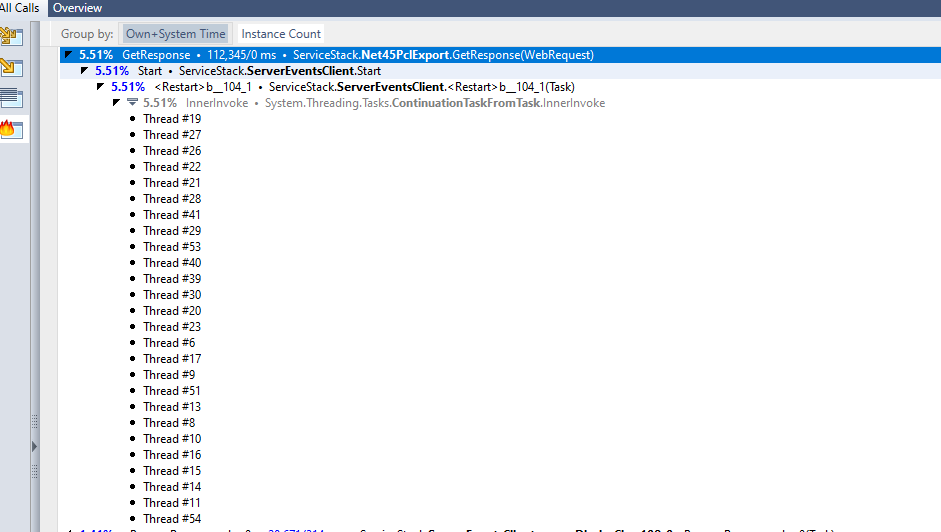
Hey there, we are running into an odd situation where CPU in a long running “always on” web app creeps up to almost 100%. We have profiled this remotely and locally and the hot spot is the ServerEventsClient.Restart method e.g.
The always on web app is a client of another web service that is also running servicestack web services. The odd thing is that we have this web app deployed on 3 separate identical Azure web apps and only one of the web apps experiences this issue. I have also recreated it locally per screenshot above.
The web app “client” is running service stack 5.8.0 (.NET Framework) and the server is running 5.6.1 (.NET core)
The server is running with a heartbeat interval of 5 seconds and an idletimeout of 30 seconds.
The exception which we get before the restart always has a format of "Message = “Last Heartbeat Pulse was 30111.47ms ago” (time varies of course)
The weird thing is that all web app clients are connecting to the exact same azure server instance however, only clients on this one particular server (which uses its own database) get these heartbeat errors (and I can also get them locally if I connect using the same settings). Same code base etc.
I am really at a loss - my solution is going to be to just Stop the events client if this error comes up but I would really like to know why it’s happening.
Just to add a little more information - this issues seems to happen to the same event channels every time. To add more clarification, each user on the client app opens up an event channel with the same name as their user ID (a mongoDB OID) but only certain user channels get this heartbeat error
Also not sure if this is relevant, but Visual Studio which I had debugging IIS Express running this just threw an unhandled exception from within ServiceStack
System.FormatException: ‘Input string was not in a correct format.’
at System.Number.StringToNumber(String str, NumberStyles options, NumberBuffer& number, NumberFormatInfo info, Boolean parseDecimal)\r\n at System.Number.ParseInt64(String value, NumberStyles options, NumberFormatInfo numfmt)\r\n at System.Int64.Parse(String s)\r\n at ServiceStack.ServerEventsClient.ProcessLine(String line)\r\n at ServiceStack.ServerEventsClient.<>c__DisplayClass108_0.b__0(Task1 t)\r\n at System.Threading.Tasks.ContinuationTaskFromResultTask1.InnerInvoke()\r\n at System.Threading.Tasks.Task.Execute()
I’m not familiar with this particular issue, but can you try with the latest v5.8.1 on MyGet as there have been a few issues detected under load that was resolved with the latest release.
Here is another weird one that might be related to this issue. So we have logging in the OnException callback and I was just investigating the logs for a server currently undergoing the high CPU situation and it’s flooded with these:
System.ObjectDisposedException: Cannot access a disposed object.
Object name: 'SslStream'.
   at System.Net.ConnectStream.EndRead(IAsyncResult asyncResult)
   at System.IO.Stream.<>c.<BeginEndReadAsync>b__43_1(Stream stream, IAsyncResult asyncResult)
   at System.Threading.Tasks.TaskFactory`1.FromAsyncTrimPromise`1.Complete(TInstance thisRef, Func`3 endMethod, IAsyncResult asyncResult, Boolean requiresSynchronization)
That is a log of the exception being sent to us in the OnException callback
Let me see if I can figure out how to get that - just to be clear, this is the exception that service stack is passing us in the OnException callback of the ServerEventsClient class
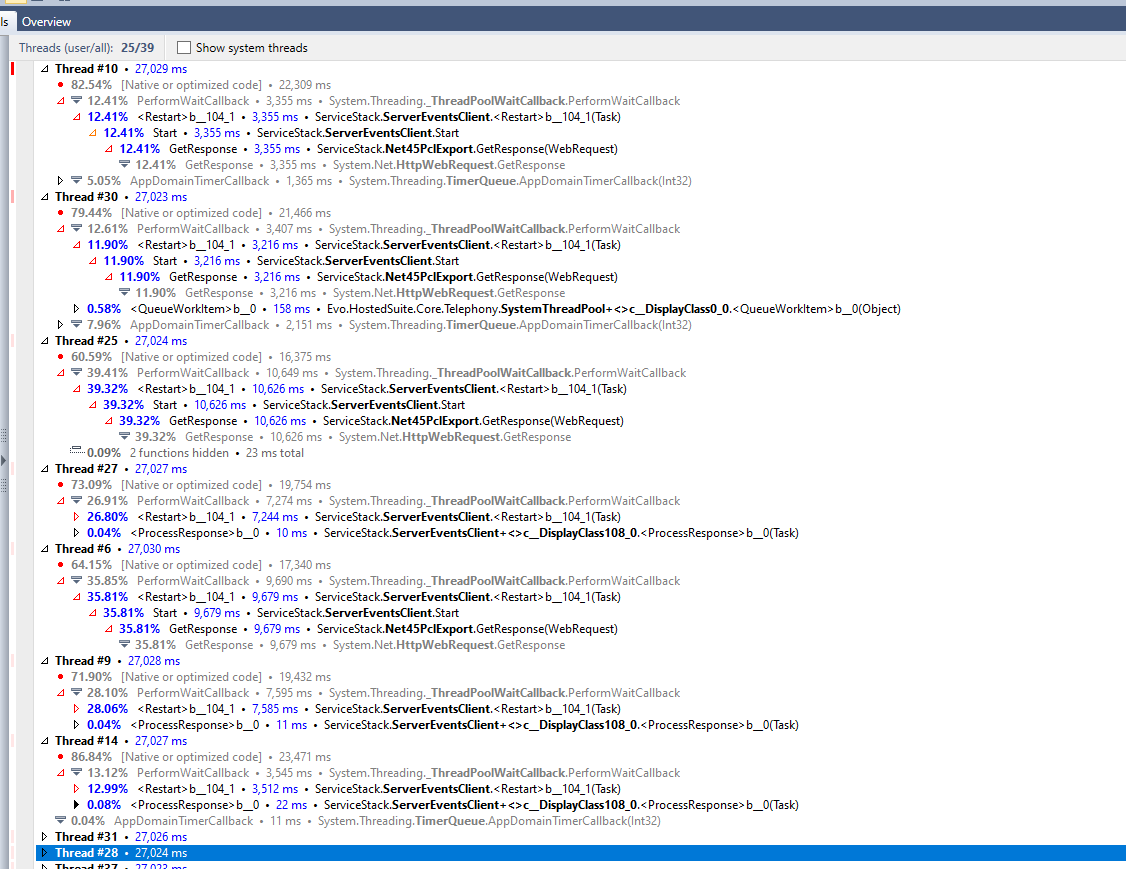
Just profiled one of our high CPU processes and all the top threads show the following stack
There are a lot more below this in the window and I’m trying to figure out what could cause this to happen. I have even put the following code in the exception handler
It may be entering an endless loop where it keeps trying to reconnect and failing. Can you show what GetStatsDescription() returns as it will display the number of errors & concurrent it has. You can try logging it in your OnException handler.
2020-03-27 09:43:27,153 [21] ERROR EvoVoiceConsole-victorconsole@reliablereceptionist.com Error in events client connected to server https://evovoice.io. Stopping. Exception:System.TimeoutException: Last Heartbeat Pulse was 30576.303ms ago Stats:ServerEventsClient SERVER STATS:
===============
Current Status: Started
Listening On: https://evovoice.io/event-stream?channels=5e3afdfaa06ba42a48a51b62
Times Started: 1
Num of Errors: 1
Num of Continuous Errors: 1
Last ErrorMsg:
===============
In the above screenshot from the profiler, it looks like Restart is being called multiple times but only one OnException ever got called, unless I am misreading the profiler output
Here’s the ServerEventsClient.cs source code. It gets called internally in 2 places, on Exception or when connection is disconnected. If you enable debug logging, e.g:
LogManager.LogFactory = new ConsoleLogFactory(debugEnabled:true);
(Or on the logger you’re using), it may show more info.
Essentially it never received a successful heartbeat response within the 30s idle timeout. So there suggests there’s an issue with the heartbeat requests. Can you use a HTTP or Packet Sniffer like Fiddler or WireShark to see if you can find more info about the failed heartbeat requests, e.g. if the requests are hanging or otherwise failing.