ServiceStack.Redis.Core ASP.NET Core and Docker Connection Hangs after 100 requests

Hi All,

I am having a very annoying issue that i hope that someone can help with.

Background: We have moved to ServiceStack.Redis.Core from StackExchange.Redis for the Sentinel offerings. We needed a more stable Redis cluster on our application. We are running a microservices architecture with asp.net core 2.2 and docker swarm. The shopping basket is stored in Redis under the users GUID. We also use it to cache users login information and any temporary data.

This is the code that i am using to connect to Redis sentinel in the Startup.cs under ConfigureServices. Ignore the else statement that is just so that we can run Redis locally for debugging purposes.

Startup.cs

        // register redis sentinel
        ServiceStack.Licensing.RegisterLicense("LICENCE_KEY");
        if (!Environment.IsEnvironment("Local"))
        {
            RedisConfig.DefaultConnectTimeout = 5;
            RedisConfig.DefaultIdleTimeOutSecs = 1;

            RedisPoolConfig redisPoolConfig = new RedisPoolConfig() { MaxPoolSize = 1000 };

            var sentinel = new RedisSentinel("REDIS_SENTINEL_DOCKER_CONTAINER_NAME")
            {
                RedisManagerFactory = (master, slaves) => new RedisManagerPool(master, redisPoolConfig)
            };

            services.AddScoped<IRedisClientsManager>(c => sentinel.Start());
            services.AddScoped<IRedisClient>(c => c.GetService<IRedisClientsManager>().GetClient());
        }
        else
        {
            services.AddScoped<IRedisClientsManager>(c => new RedisManagerPool(Configuration["ConnectionString"]));
            services.AddScoped<IRedisClient>(c => c.GetService<IRedisClientsManager>().GetClient());
        }

BasketRepository.cs

    private readonly ILogger<RedisBasketRepository> _logger;
    private readonly IRedisClient _cache;

    public RedisBasketRepository(ILoggerFactory loggerFactory, IRedisClient cache)
    {
        _logger = loggerFactory.CreateLogger<RedisBasketRepository>();
        _cache = cache;
    }

    public async Task<BasketItem> GetBasketItemAsync(Guid userId, Guid itemId)
    {
        BasketItem basketItem = null;

        CustomerBasket customerBasket = null;

        var data = _cache.Get<string>(userId.ToString());

        customerBasket = JsonConvert.DeserializeObject<CustomerBasket>(data);

        basketItem = customerBasket.Items.SingleOrDefault(s => s.Id == itemId);

        return basketItem;
    }

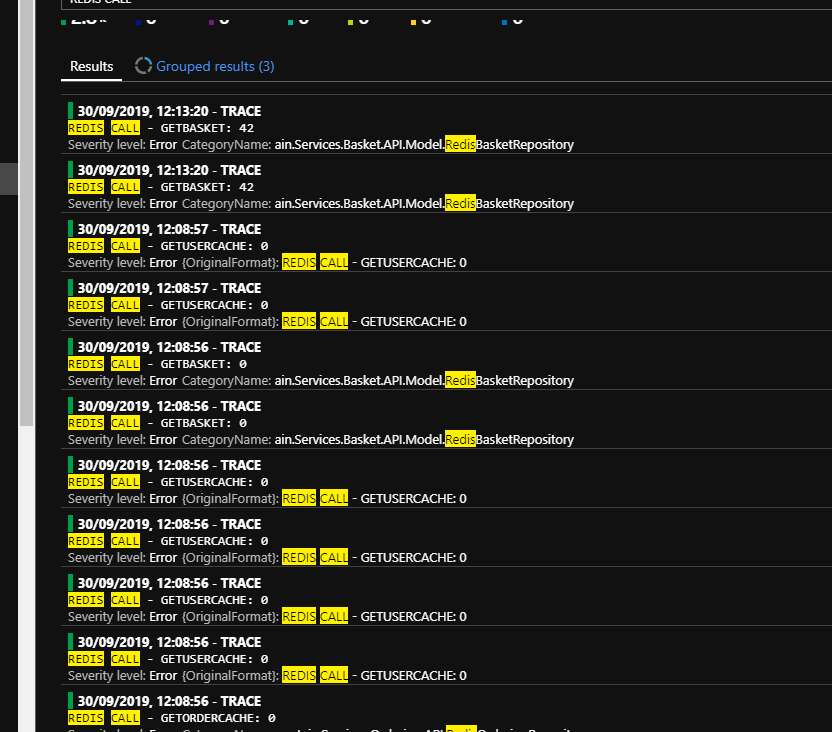
Now to the problem, We have absolutely no problems for the first 50 or so requests (there are 2 Redis connections on the same page so more like 100 connection) and the page load speed is lightning fast then the page hangs and loads for roughly 10 seconds or so, then goes back to its lighting fast load speeds.

My initial thoughts are that the connections are not being free’d up and the wait period is them getting disposed.

I have tried adding the IRedisClientsManager & IRedisClient as Singletons and Transient, I have also tried just injecting the IRedisClientsManager and wrapping the IRedisClient into a using statement for each query. The same thing happens in every instance

I have tried playing around with the default RedisConfig
RedisConfig.DefaultConnectTimeout = 5;
RedisConfig.DefaultIdleTimeOutSecs = 1;
RedisConfig.DefaultRetryTimeout = 1000;
etc

Am i missing a setting somewhere or could this be to do with my sentinel setup, i mean its a very basic setup on docker with 3 sentinels, 1 master and 4 replicas.

Any help would be very much appreciated.

Joe.

The IRedisClientsManager should always be registered as a singleton and I’d personally register the IRedisClient as transient or not registered in the IOC and just used within a using scope:

using (var redis = redisManager.GetClient())
{
}

Can you try not changing any of the default configuration, or just specify a pool size:

RedisConfig.DefaultMaxPoolSize = 100;

Then change to access redis instances with a using statement, if you’re only reading from the cache you can use GetReadOnlyClient() where it will use a client from one of your replicas (if you’re using the RedisSentinel default PooledRedisClientManager), e.g:

using (var redis = redisManager.GetReadOnlyClient())
{
}

When it starts to hang can you have a look at what RedisStats.ToDictionary() is reporting either returning it in a service or you can dump to a string and log:

var stats = RedisStats.ToDictionary().Dump();

Are you able to find out which method call it’s hanging on? Otherwise you can log it to see if it’s when it fetches an available connection with something like:

var watch = System.Diagnostics.Stopwatch.StartNew();
using (var redis = redisManager.GetReadOnlyClient())
{
// log watch.ElapsedMilliseconds
}

Just wanted to update this as we are continuing to debug and find a solution

I have done as you have suggested:

  • IRedisClientsManager has now been registered in DI as a Singleton
  • IRedisClient has been removed from DI and is now wrapped in a using statement for every call.
  • We are now using GetReadOnlyClient() when retrieving data and GetClient() for writing data.
  • We have added a page to display RedisStats.ToDictionary().Dump();
  • We have added a timer to the calls

Here’s what is perplexing:
RedisStats:
{ TotalCommandsSent: 625, TotalFailovers: 0, TotalDeactivatedClients: 0, TotalFailedSentinelWorkers: 0, TotalForcedMasterFailovers: 0, TotalInvalidMasters: 0, TotalNoMastersFound: 0, TotalClientsCreated: 3, TotalClientsCreatedOutsidePool: 0, TotalSubjectiveServersDown: 0, TotalObjectiveServersDown: 0, TotalPendingDeactivatedClients: 0, TotalRetryCount: 0, TotalRetrySuccess: 0, TotalRetryTimedout: 0 };

There are no retries or timeouts and the slowest connection to redis is only 42ms

Yet we are still seeing the slow page load once every 30 - 50 reloads. This was not happening when we were running StackExchange.Redis and Redis Cluster.

One theory i have at the moment is that we are registering the sentinels in the startup.cs file by naming the sentinel container i.e. var sentinel = new RedisSentinel(“BlueMountain-Infrastructure_sentinel”)

So i am wondering if it is picking up (sentinel:23679 + ip1:23679) + ip2:23679 + ip3:23679 then maybe having problems resolving one of them. But i have no idea how to debug this…

Any additional help is still very much appreciated.

Joe.

No errors, failovers or retries, so I’m not seeing anything that stands out that could be the issue.

I’d be focusing on finding out exactly where the time is spent during the slow payload. Something like MiniProfiler for ASP.NET Core should help in identifying where it’s occurring.

Wrapping potential APIs in labelled steps should be able to capture it:
https://miniprofiler.com/dotnet/HowTo/ProfileCode

Adding the IRedisClient.Host/Port to the step label may could help identifying it it’s a specific server or a random one. Be sure to add a step before and after using the redis client so you can determine if the time is spent in or outside the redis client.

Hi All,

Just wanted to update this issue. I got down to the bottom of it.

It was nothing to do with ServiceStack or Redis Sentinel, i had some backround stuff that was erroring and throwing too many errors then bombing out the Kestrel Server - the slow loading was all to do with Kestrel recovering.

Thanks for all the help
Joe.

1 Like

Great, glad to hear you managed to get to the bottom of it.