SSE is bringing IIS to it's knees and locking forcing reboots

We have been implementing SSE in production since May 10. We currently use a redis setup for it. Since then we have noticed intermittent issues with servers locking up, not responding and being taken out of our load balancer. Often the only recourse is rebooting the server.

Event logs show nothing useful except a warning for app pools getting shutdown. We did notice 1000s of errors start coming in via bugsnag as mentioned Here. There is no other useful logging or information we can pull from servers that gives us any clues.

In the last 2 days it’s gone from occasional to not being able to keep a server up. Within 5 min of bringing a server online it locks up. After basically throwing darts we disabled sending SSE and everything calmed down instantly. Subscriptions are still being made etc, just we are not sending out messages. This is about all we have to go on right now.

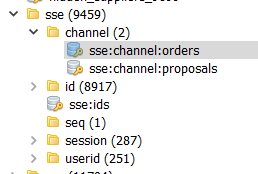
We typically have 2 m5.large windows servers running. There are two subscription channels that run with nothing additional customized in the sse startup. We notify via direct to userId only. A sample of that payload is below.

The IServerEvents is injected into the service class and is basically the following function that is called to send messages

 private void SendServerProposalUpdateMessage(int proposalId, UserInfo userInfo)
 {
        var httpResult = Get(new ProposalDetailRequest() { ProposalId = proposalId});
        serverEvents.NotifyUserId(userInfo.Id.ToString(), httpResult.Response, ProposalChannelName);
 }

Any suggestions or thoughts would be more than helpful at this point.

Payload:

cmd.ProposalDetailResponse {"id":79169,"name":"Image test","total":6040.7920,"currentVersion":1,"createdDate":"2017-07-25T17:21:58.0700000","modifiedDate":"2018-05-22T00:21:42.9186820","number":117,"status":"Draft","discount":100,"discountAmount":100,"discountType":"Fixed","clientLastOpenedDate":"2018-05-20T07:50:00.6677730","hideItemPrices":false,"hideModelNumbers":false,"hideImages":false,"hideLaborPrices":false,"hideRoomTotals":false,"hideLaborTotal":false,"hideCompanyAddress":false,"paymentSchedule":"PAYMENT SCHEDULE\r\n","projectTerms":"PROJECT TERMS","previewUrl":"//xxxxxxxxxx/79169/014d-4ec9-b5c8-2a55d3a81b1b?Preview=true","userModifiedFirstName":"Amber","userModifiedLastName":"Cactus","proposalClientId":49918,"clientName":"Reed","stateId":10,"stateName":"Florida","countryId":1,"countryName":"United States","dealerId":7731,"dealerUserName":"Amber Cactus","dealerEmail":"test@mailinator.com","dealerWebSite":"www.xxxxx.com","dealerAddress1":"2345 fake Road","dealerAddress2":"Suite AB3","dealerCity":"Greensboro","dealerStateId":10,"dealerStateName":"North Carolina","dealerCountryId":1,"dealerCountryName":"United States","dealerZip":"27409","dealerCompanyPhone":"(800) 488-5555","companyName":"Amy Test ","aboutUs":"<p><span style=\"font-size: 30px\">ABOUT US</span></p>","logoImageAssetId":9412615,"cost":0,"rooms":[{"parts":[{"partRoomId":2193016,"partId":2001501,"model":"XBR55X900E","description":"Sony Bravia XBR-55X900E 55" class (54.6" diag) 4K HDR Ultra HD TV","supplierId":1574,"sellPrice":1915.2000,"cost":957.6000,"quantity":2,"imageAssetId":6275101,"imageUrl":"https://res.cloudinary.com/c_limit,w_132,h_72,d_emptyPart.png/v63662545303/xxxxxxx/Part/6275101","brandName":"Sony","isCatalogModelName":true,"isInStockStatus":""}],"labors":[],"miscItems":[],"description":"<p>Area description modified again</p>","total":3830.4000,"id":352145,"name":"copy"},{"parts":[{"partRoomId":2193025,"partId":2001501,"model":"XBR55X900E","description":"Sony Bravia XBR-55X900E 55" class (54.6" diag) 4K HDR Ultra HD TV","supplierId":1574,"sellPrice":1915.2000,"cost":957.6000,"quantity":1,"imageAssetId":6275101,"imageUrl":"https://res.cloudinary.com/c_limit,w_132,h_72,d_emptyPart.png/v63662545303/xxxxxxx/Part/6275101","brandName":"Sony","isCatalogModelName":true,"isInStockStatus":""}],"labors":[],"miscItems":[],"total":1915.2000,"id":529179,"name":"Copied"}],"tax":7,"taxTypes":["Labor","Parts","None"],"taxAmount":395.1920,"partTotal":5745.6000,"laborTotal":0,"profitTotal":2772.8000,"profitPercent":49,"profitPartTotal":2772.8000,"profitPartPercent":49,"profitLaborTotal":0,"profitLaborPercent":0,"totalQuantity":3,"coverImageAssetId":9412509,"aboutImageAssetId":6915641,"emailToClient":"{\"defaultMessage\":\"Hi there,\\r\\n\\r\\nI've completed your proposal, simply click below to view a web-based version. Let me know if you have any questions!\\r\\n\\r\\nAmy B\\r\\n\"}","histories":[{"id":401186,"proposalVersion":0,"userName":"Amber Cactus","createdDate":"07-26-17 (01:21 am )","action":"Proposal Created","actionValue":"Created","notes":[]},{"id":783278,"proposalVersion":0,"userName":"Reed","createdDate":"05-20-18 (03:49 pm )","action":"Proposal Opened","actionValue":"OpenedByClient","notes":[]},{"id":783279,"proposalVersion":0,"userName":"Reed","createdDate":"05-20-18 (03:49 pm )","action":"Proposal Opened","actionValue":"OpenedByClient","notes":[]},{"id":783280,"proposalVersion":0,"userName":"Reed","createdDate":"05-20-18 (03:50 pm )","action":"Proposal Opened","actionValue":"OpenedByClient","notes":[]}],"isPreview":false}    

First I’d be looking at Request monitoring to see if there’s anything out of the ordinary. IIS has a Request Monitor feature and appcmd feature that provides details on what’s happening within the IIS worker process. ASP.NET also maintains performance counters you can monitor with the perfmon App. Hopefully monitoring will be able to shed some light on what the underlying issue is.

Otherwise I don’t really have any general recommendations other than double-checking IIS Request Limits, ensure dynamic compression is disabled, remove any IIS features you don’t need, etc.

From your description it sounds like the issue is with sending events, if that’s the case I’d recommend reducing your SSE payloads, i.e. use SSE notifications to send “notifications” which trigger the clients to download their larger payloads using normal HTTP Requests.

If being able to change hosts is an option you can look into that to see if the issues are mitigated when not running on IIS, e.g. running a .NET Core App or self-Host HTTP Listener App. If you need to run on the .NET Framework you can run ASP.NET Core Apps on the .NET Framework.

Don’t really have any other suggestions.

Unfortunately appcmd doesn’t shed any light as all the top requests are the event stream connections (unless this is a problem itself?). Some have been open for hours - which would be typical. Perfmon also doesn’t lead us anywhere. Dynamic compression is disabled as well.

Which leads to the only other option we were thinking of as well, which is do change the payload to return smaller more directed information, or as you say, have it ask the browser to make the request for full details.

We are not able to switch to .net core yet, but have started that migration.

Can you help me understand the number here in redis? Looking at the keys in the channels, each has about 9k. What’s the difference between ids and sessions? Do ids stick around after clients are closed? Does this eventually get evicted? It seems like a lot of ids considering we have about 2k active users a day, and these are the numbers from overnight usage.

The sse:id collection is for every unique SSE subscription created when clients connect or reconnect to the SSE /event-stream. They’re normally cleaned up as part of the normal operation as client connections are dropped off but if the AppDomain recycles they may not get a chance to remove themselves.

There is a Reset() API on IServerEvents you can use to flush all local connections and Redis SSE metadata subscriptions:

container.Resolve<IServerEvents>().Reset();

You can try creating a Service that calls this API on all AppServers (at the same time) when the App Servers are locked which will flush the local SSE connections and redis SSE metadata. Calling it after deployment to all AppServers is another good time to call it to remove any zombie metadata.

Ok. Since it’s a single redis instance, is this something that can be called by an external service? We have another server that runs jobs for us. Looking at the code I suspect that the local.Reset is only something that can be done by servers directly? And now that I’m looking at this code, it appears that a lot is still handled InMemory. I guess I was incorrectly under the assumption that if we enable redis for SSE there wasn’t anything InMemory anymore.

Our app pools are set to be always active and not recycle. However, I’m wondering if memory is part of our problem. If SSE is still doing things in memory and not being cleaned up, it could be taking IIS down due to resources?

The issue isn’t the single Redis instance, it’s the multiple App Servers, a single App Server can’t clear out zombie Redis metadata because it only knows about its own active subscriptions, not the subscriptions that are active on the different App Servers. So when you call Reset() it should be done on all App Servers simultaneously so they all flush their local subscriptions and Redis metadata at the same time.

Redis Server Events uses the same memory as a local Memory Server Events because it needs to track its local subscriptions connected to the App Server. It doesn’t hold information about any of the App Servers other subscriptions in memory (which is what’s stored in Redis), it only holds its own active subscriptions. But it shouldn’t leak memory because it actively cleans up any inactive connections. I wouldn’t expect it to take up too much memory, it just needs to hold a bit of metadata for each subscription in concurrent dictionaries and a persistent Request connection.

If your App Servers used up all its memory that could explain degradation in performance, but I doubt the memory SSE uses was the main cause. How much memory does the monitoring says is used?

Can you try upgrading to the latest v5.1.1 that’s now on MyGet.

I’ve fixed an issue with handling async exceptions from writing to disconnected clients in this commit which may help.

Thanks. We will look into that. Current re-structuring to send a message to force client to ask for payload.

We are having the same issues, but luckily not (yet?) in production. But on local development machine with recompile/iis recycles, it happens multiple times a day. Only way to fix is a double iisreset.

I did upgrade today to your MyGet 5.1.1 version, unfortunately, the lockup is still there. When I disable ServerSentEvents, the IIS Lockup disapears…

I didn’t update yet as it’s slotted for our next sprint. We did however modify messaging to use a small request message, which tells the client to fetch the updated info it needs. We are still testing in development, but not sure how it will work out in production. I’ve also implemented it such that on app startup, the reset function is called (so when app pool restart it would clear as suggested above).

However, throwing more cpu/memory at the issue with a large aws instance has gotten us through the last week without any problems.

I’ll post our production results here next week when they go live.

Can anyone provide a stand-alone repro that I can run locally to debug/resolve the issue?

I might be able to try next week to see if i can repeat in a smaller app.

I haven’t been able to repro any dead locks after a long stress test but I did resolve a potential memory leak in this commit. This change is available from the latest v5.1.1 that’s now available on MyGet.

Sorry for the delay but I was away and then dealing with the mountain that is work.

So, unfortunately we had to switch from SSE to a hosted solution as we continued to have outages due to SSE. We were never able to replicate it in our development environments as we couldn’t stress the system enough.

As mentioned above, the messages themselves were large - but even after reducing to a few bytes - we still had the problem.

The best I can provide right now is the following graphs that show the number of connections and messages we have seen in the last week.

https://gmkr.io/s/5b19334a4adf8617f7d2c1b6/0